
Happy New Year!
I’ve had the same desktop hardware for over 5~ years. I recently upgraded my motherboard and CPU, redid the whole build. Pictures will come soon once I tidy things up. But for now, lets see the 4790k benchmark and tests perform! Also, overclocking goodness.
Was it worth the $350?
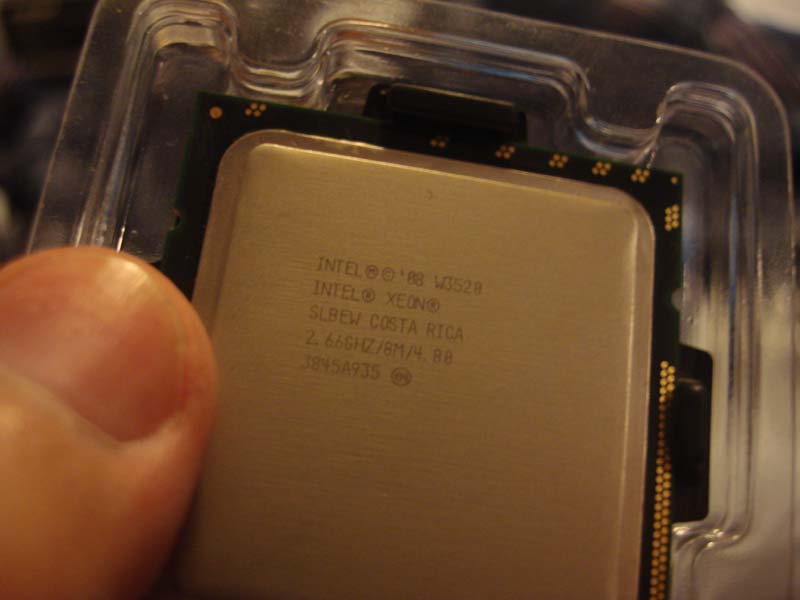
I came from an Intel Xeon w3520 based on the Bloomfield 1st generation i7 ’08 architecture run ning in an EVGA X58 Classified motherboard that I think I purchased in mid 2009. I had this baby clocked to 3.6GHz for regular use, but I had gone higher to 4.1GHz before as well.
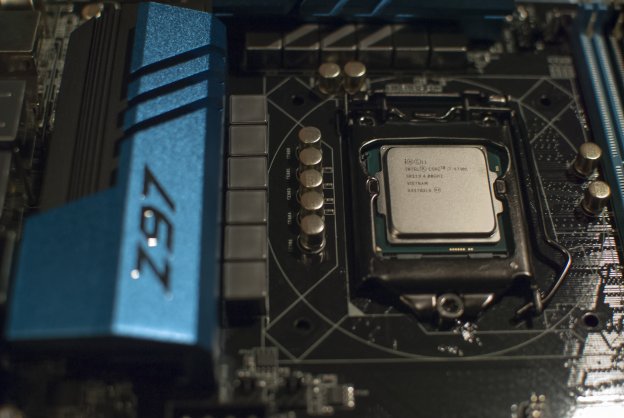
To start off 2015, I got myself an Intel Core i7 4790k (aka Devil’s Canyon series) based on the Haswell 4rth generation i7 ’14 architecture to run in an Asrock Z97 Extreme 4 motherboard. It runs a 4.0GHz stock clock and it took only a few setting changes to make it run a solid 4.6GHz. So… thats a WHOLE 1.0 GHz I went up!
40C idle
Intel 4790k @ 4.6GHz
26C idle
Old Xeon
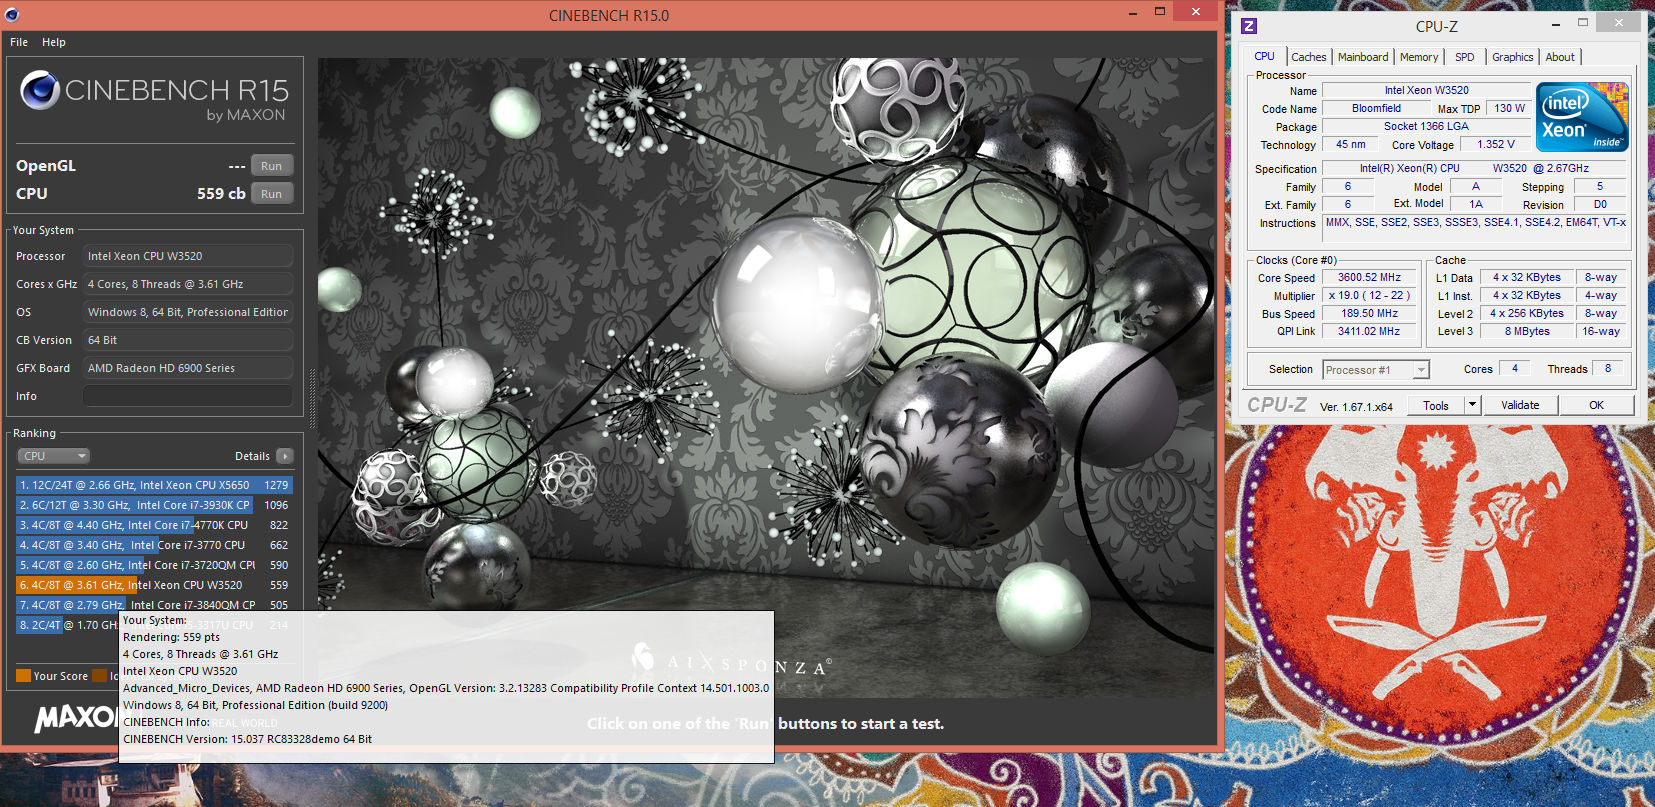
So, onto the benchmarks. We have the Xeon @ 3.6GHz, stock 4790k @4.0GHz, and an OC’d 4790k @ 4.6GHz. I ran a suite of Cinebench, 3DMark, various Sandra CPU tests, Hyper Pi, Uniengine Heaven, and last but not least – my very own Rubiks Cube Solver (single threaded C++). You can click on the CPU titles for the images.
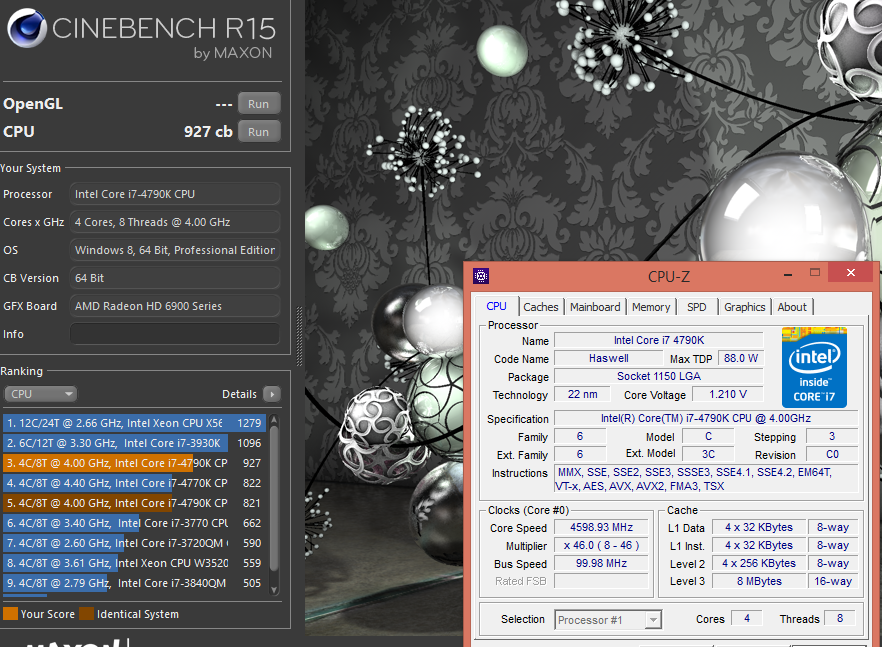
| Cinebench R15 | |
|---|---|
| Xeon W3520 @ 3.6 | 449cb |
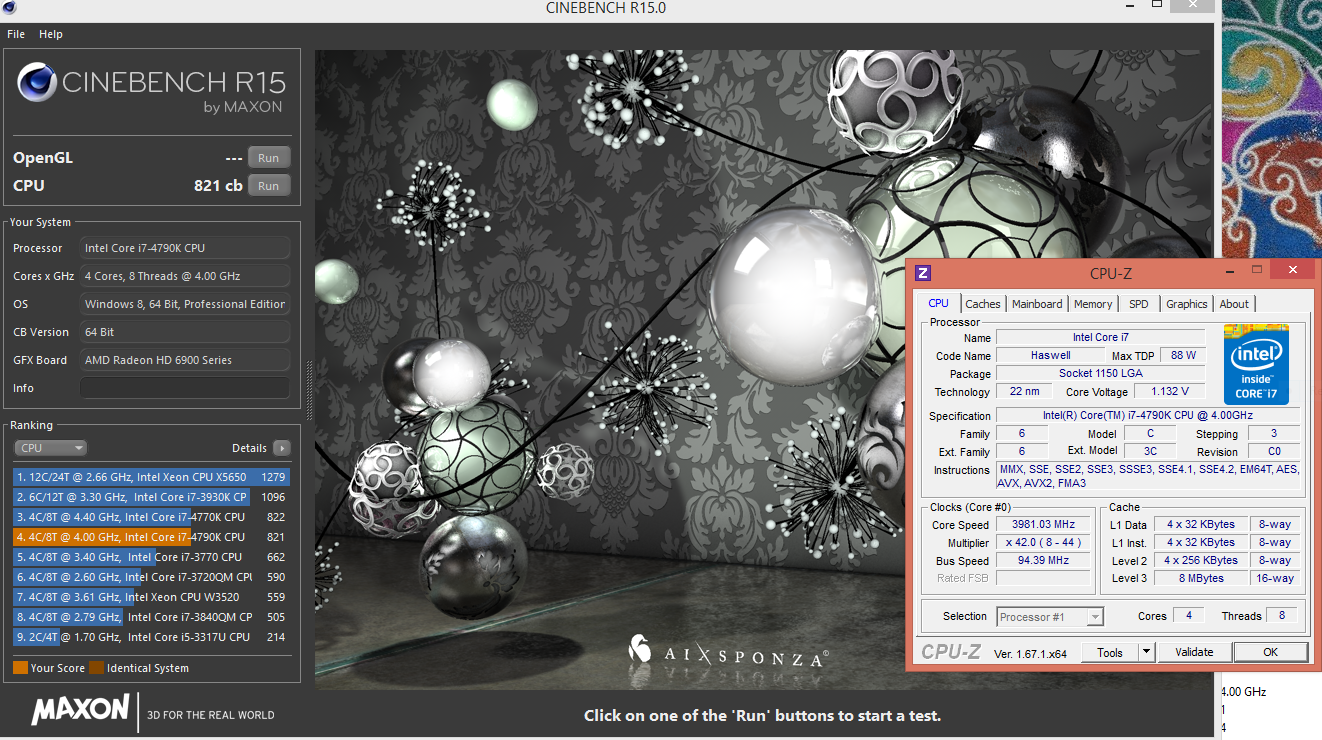
| Core i7 4790k @ 4.0 | 821cb |
| Core i7 4790k @ 4.6 | 927cb |
Here in Cinebench we see very straight up improvements. I was quite happy to see this as I do the occassional renders and video editing. I hope to actually increase my Blender/Maya use in the near future as I get into work more.
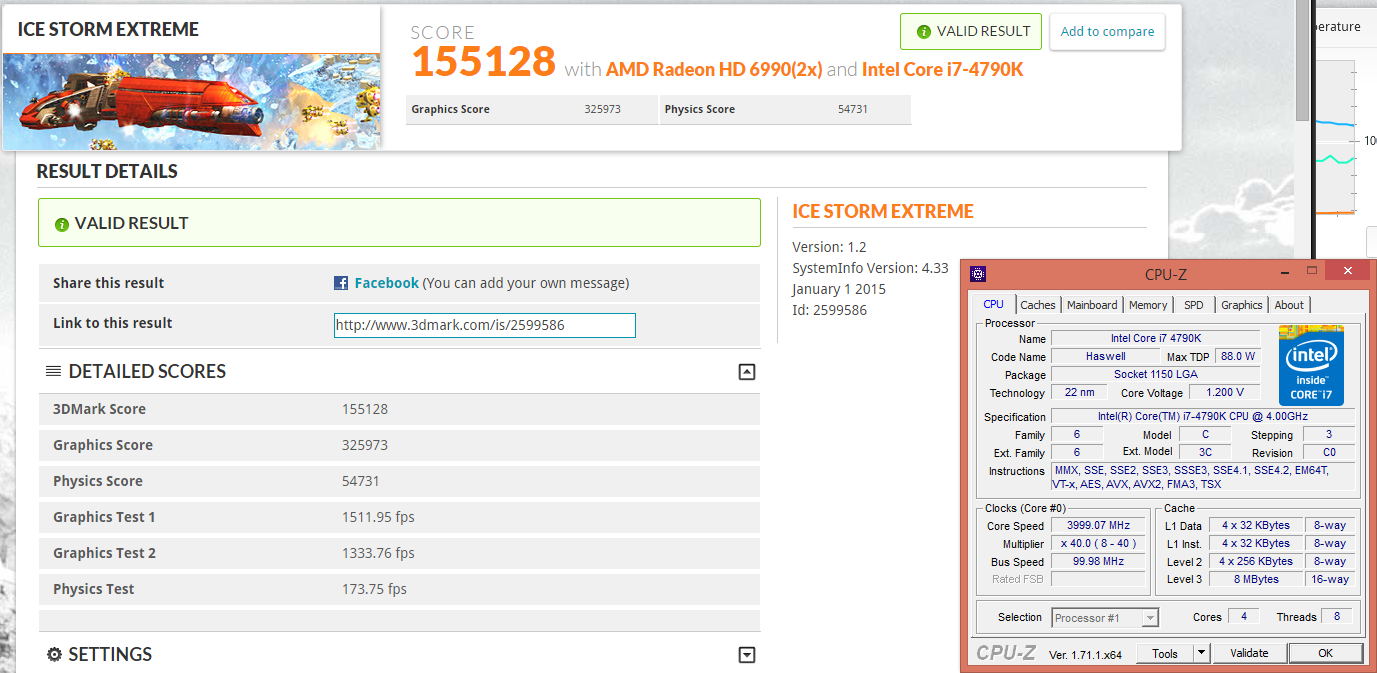
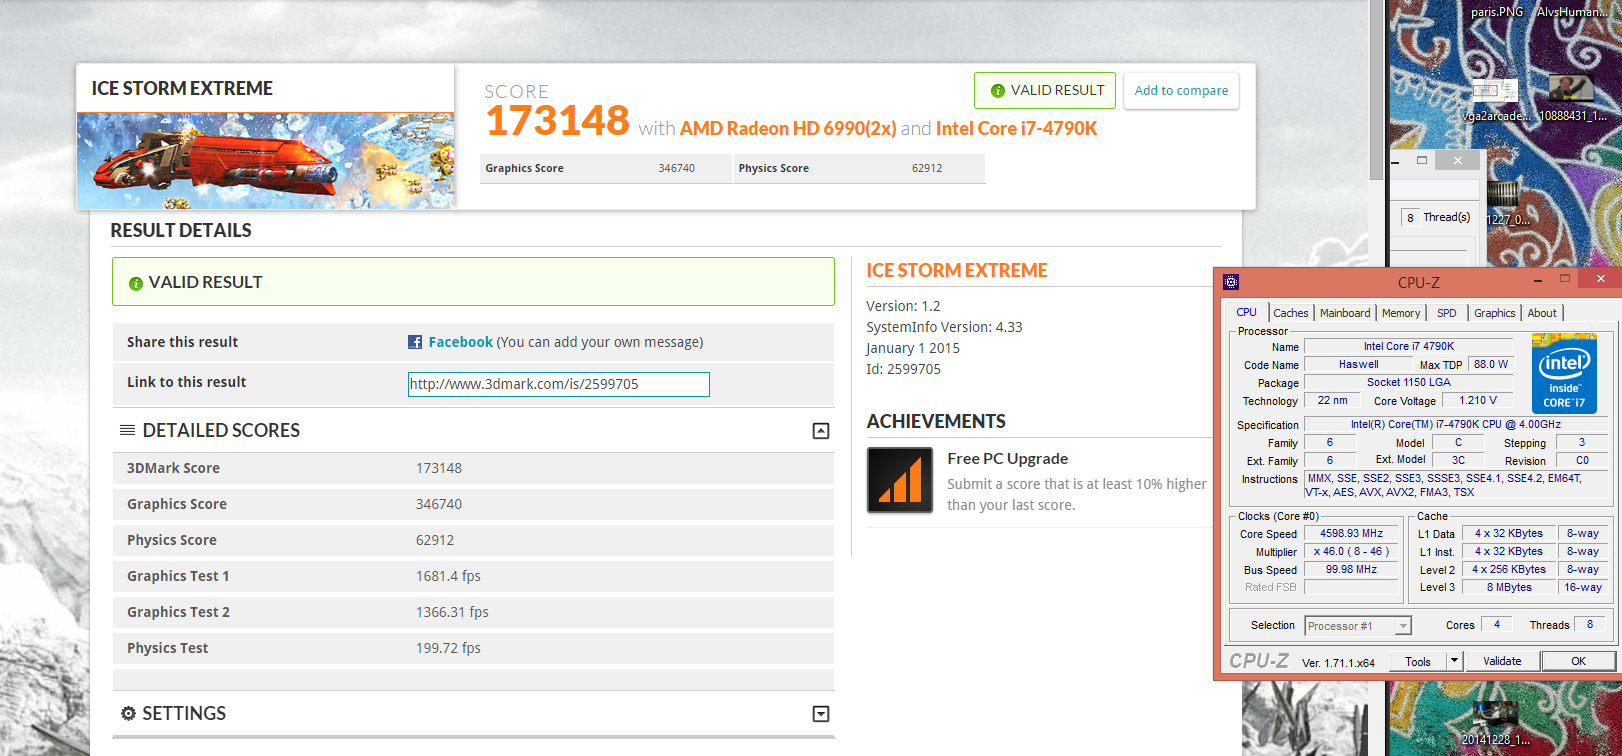
| 3DMark IceStorm Extreme | Overall Score | Graphics | Physics |
|---|---|---|---|
| Xeon W3520 @ 3.6 | 119763 | 233610 | 44264 |
| Core i7 4790k @ 4.0 | 155128 | 325973 | 54731 |
| Core i7 4790k @ 4.6 | 173148 | 346740 | 62912 |
IceStorm Extreme is a “mobile” benchmark, so these numbers are huge. All 3 system configs were getting over 1000FPS. But, you can clearly see that even the graphics score greatly improved thanks to the CPU. Mind you, the GPU (AMD 6990) stayed exactly the same between all tests!
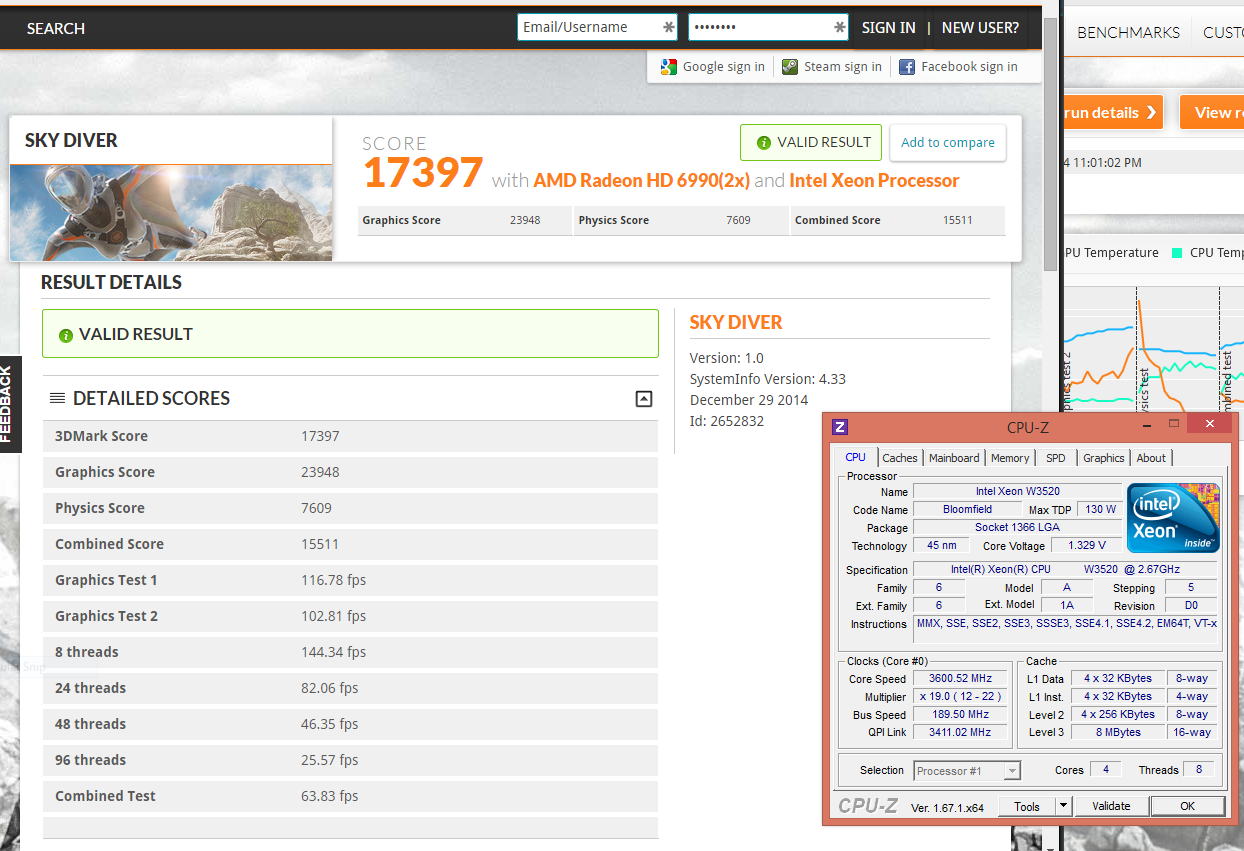
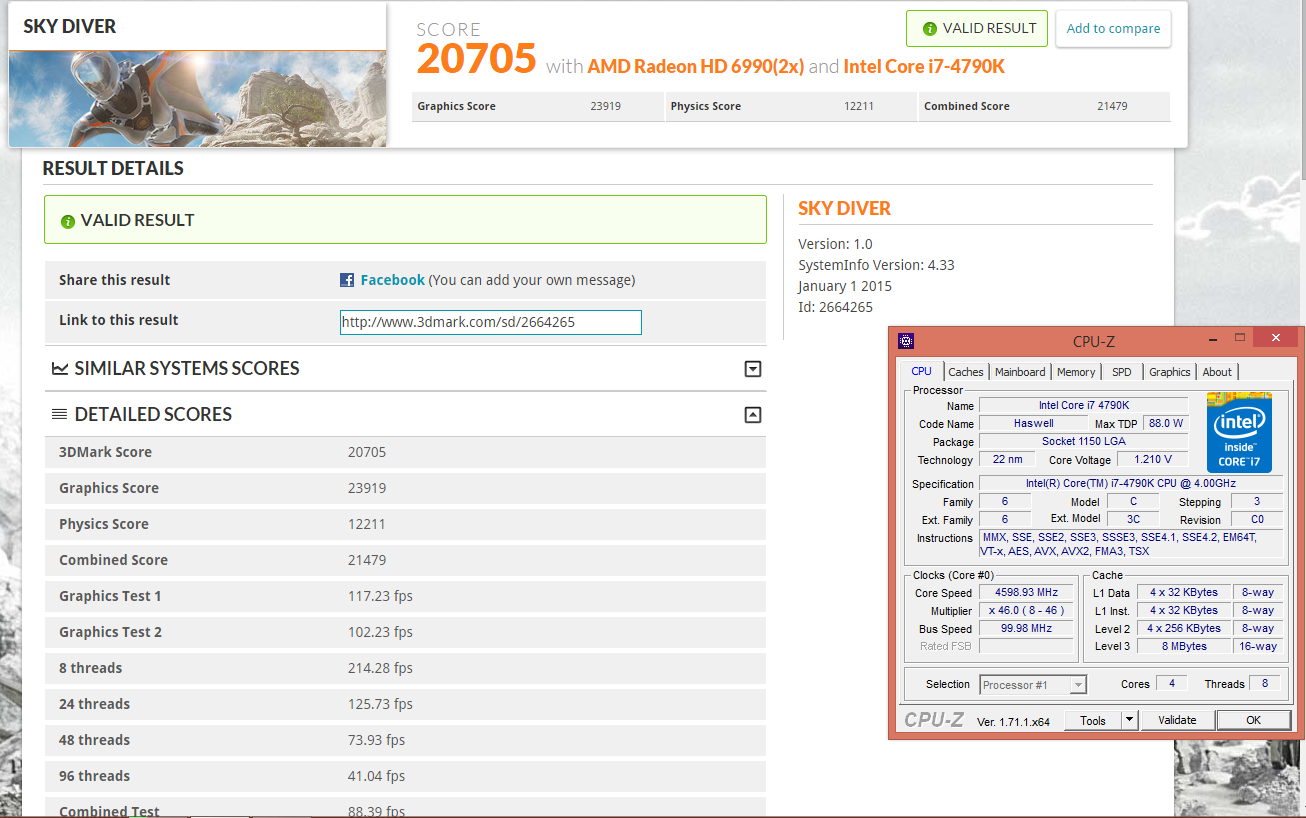
| 3DMark SkyDiver | Overall Score | Graphics | Physics | Combined |
|---|---|---|---|---|
| Xeon W3520 @ 3.6 | 17397 | 23948 | 7609 | 15511 |
| Core i7 4790k @ 4.0 | 20122 | 24036 | 11031 | 20436 |
| Core i7 4790k @ 4.6 | 20705 | 23919 | 12211 | 21479 |
SkyDiver is a bit more intense and is meant for moderate gaming machines and laptops. Quite a pretty benchmark. We see, again, a huge 3k score jump from Bloomfield to Haswell. But, we also see only a small change between 4.0 and 4.6GHz sadly. While the Physics and Combined score go up, graphics kind of wavered for whatever reason. We’ll be sure to see some of that in the next benchmark.

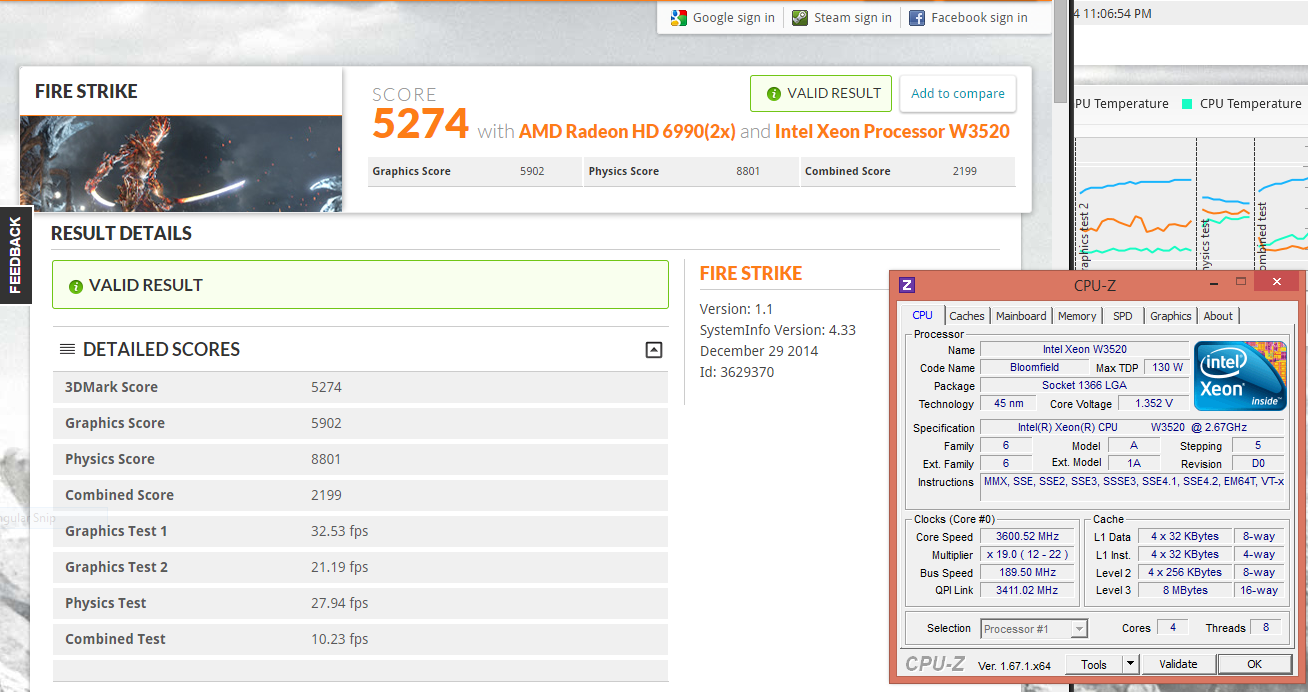
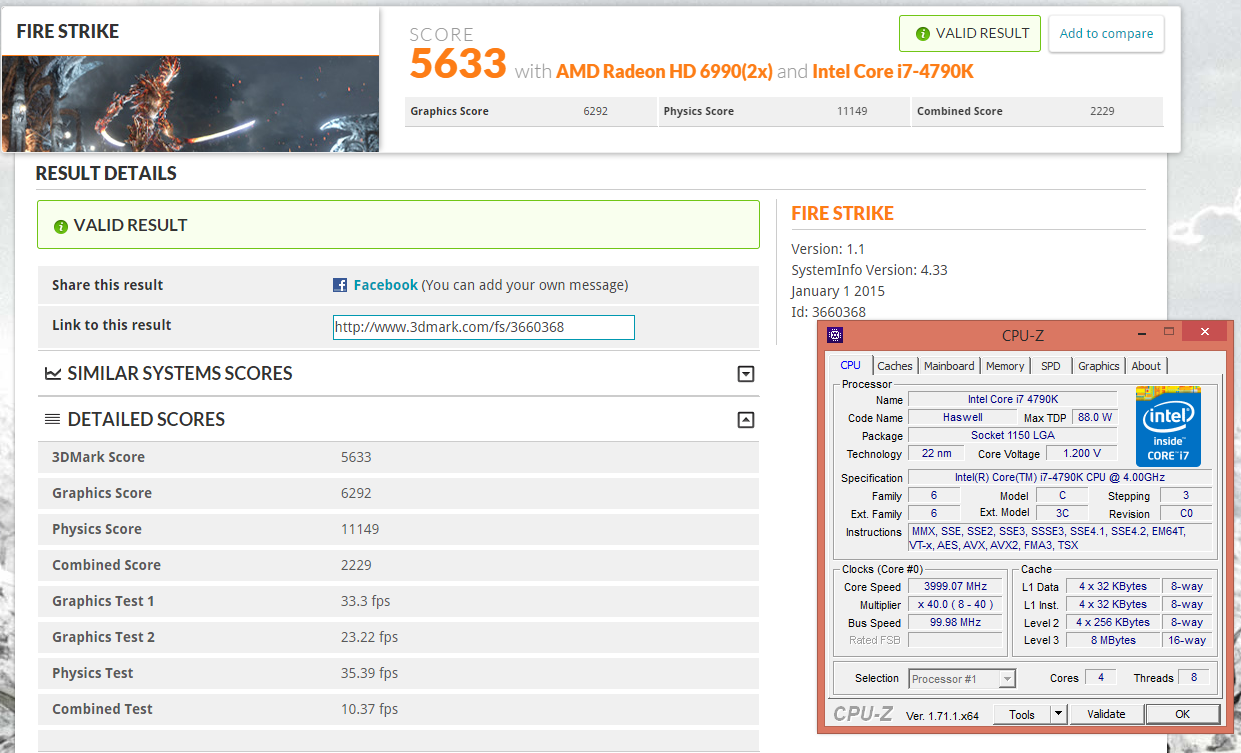
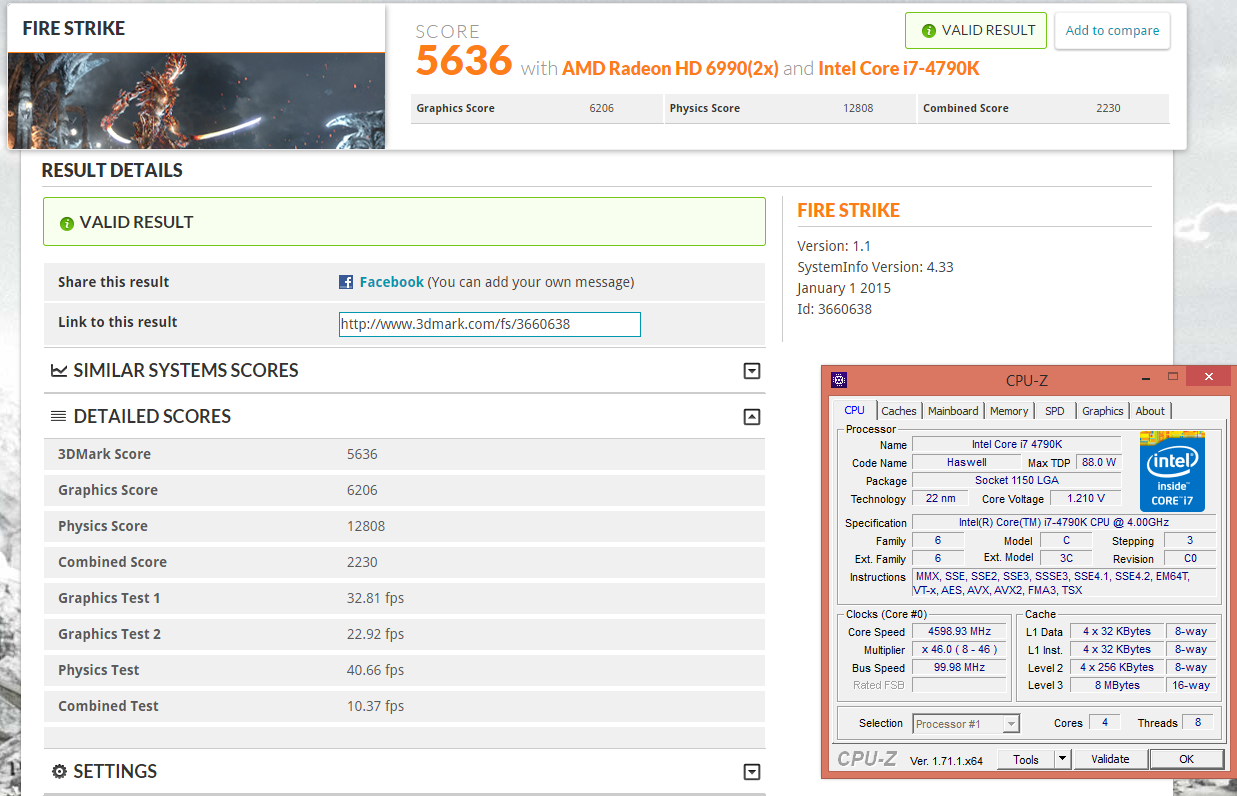
| 3DMark FireStrike | Overall Score | Graphics | Physics | Combined |
|---|---|---|---|---|
| Xeon W3520 @ 3.6 | 5274 | 4902 | 8801 | 2199 |
| Core i7 4790k @ 4.0 | 5633 | 6292 | 11149 | 2229 |
| Core i7 4790k @ 4.6 | 4636 | 6206 | 12808 | 2230 |
FireStrike is really intense. The CPU physics tests hold up though – a 3,000~ jump in score is pretty good. Even the 4.4GHz jumps up a 1,000 from 4.0. However, that won’t save the GPU. Its hard for my 6990 to break 30FPS on this bench, truly. Thats why you see that despite the architecture change for the CPU, I’m bottlenecked by my 6990. Its getting old and is possibly due for an upgrade. Based on the Antilles architecture from AMD, its several generations old now. But it is 2 GPUs in 1 (Crossfire/SLi in a single card), so it holds up well for high resolution gaming. I use triple monitors when I’m not benching (4700×1080 resolution).
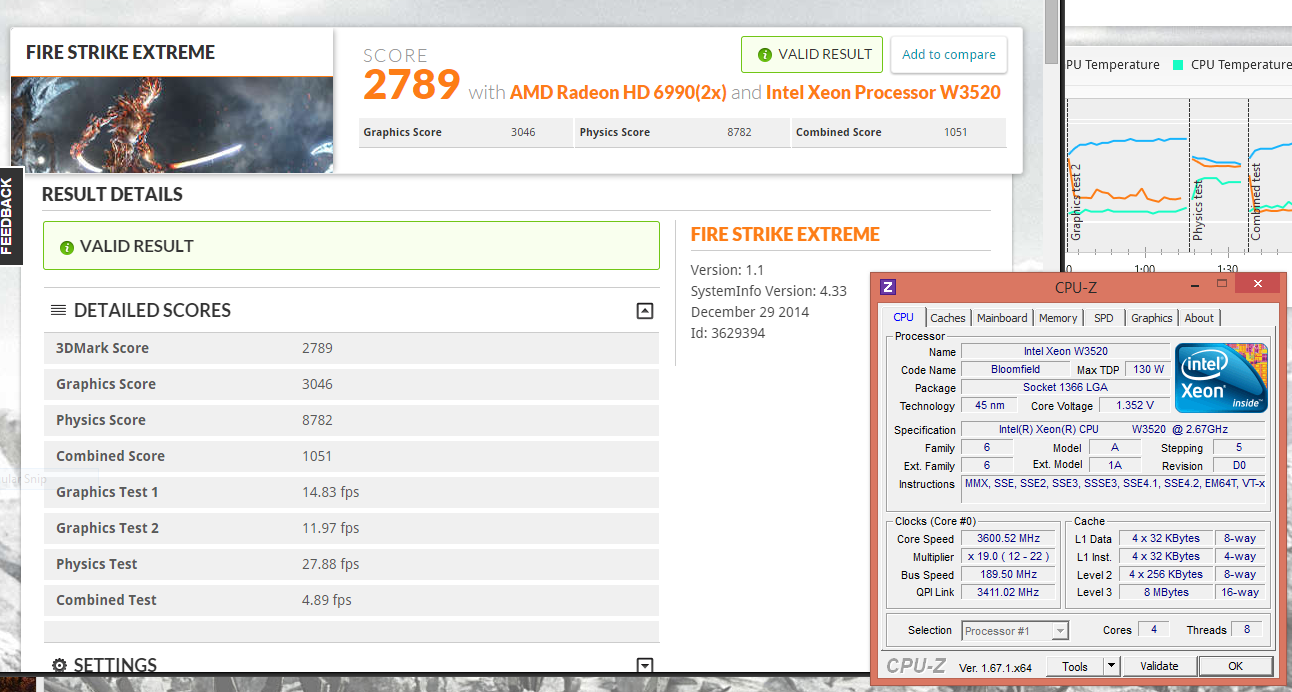
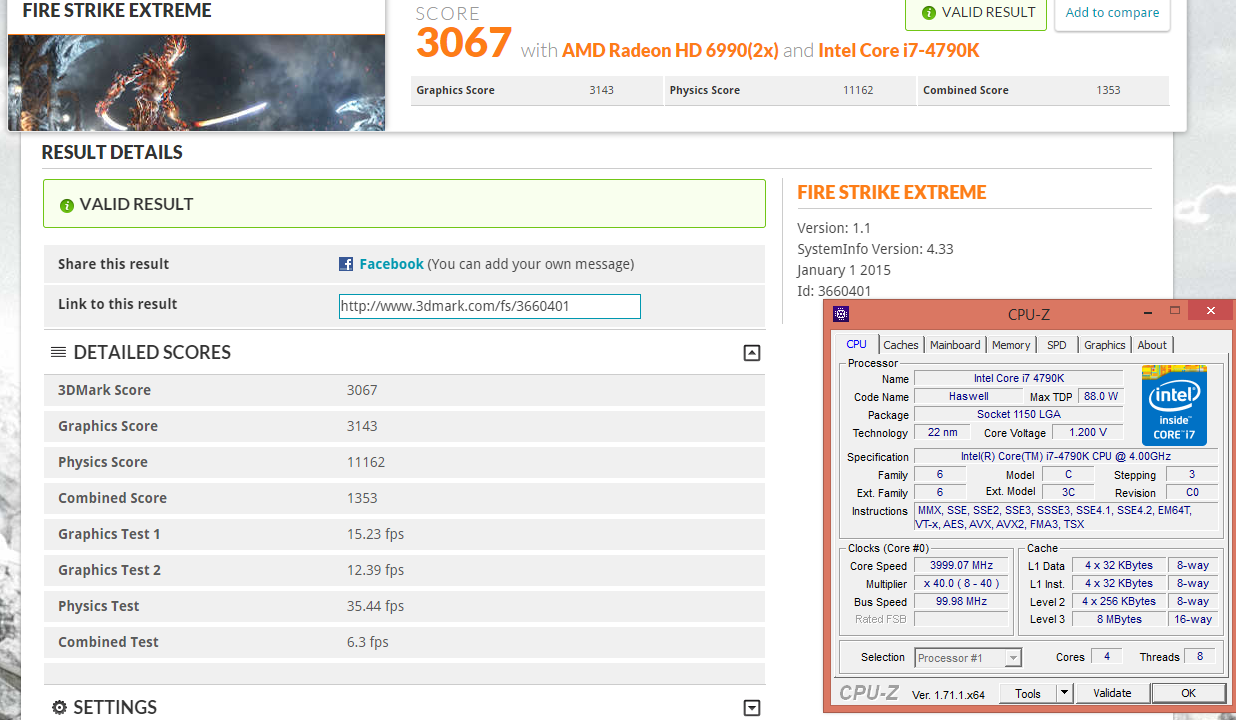
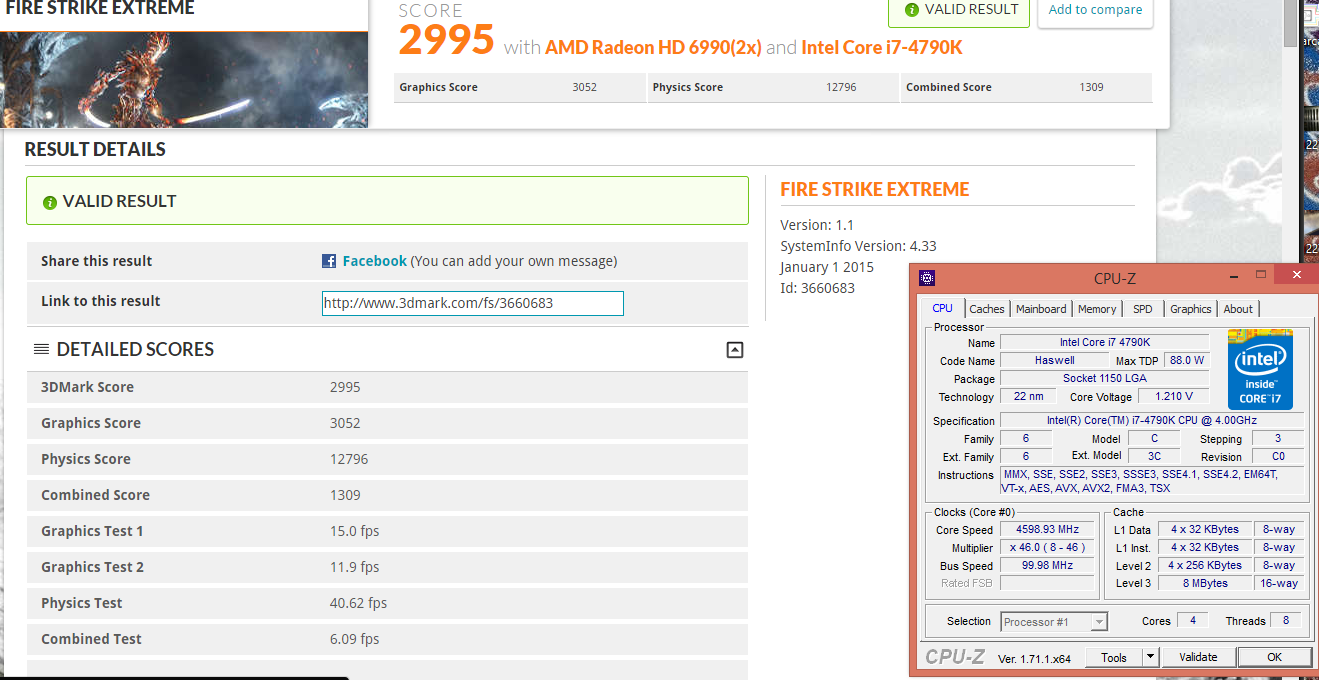
| 3DMark FireStrike EXTREME | Overall Score | Graphics | Physics | Combined |
|---|---|---|---|---|
| Xeon W3520 @ 3.6 | 2789 | 3046 | 8782 | 1051 |
| Core i7 4790k @ 4.0 | 3067 | 3143 | 11162 | 1353 |
| Core i7 4790k @ 4.6 | 2995 | 3052 | 12796 | 1309 |
FireStrike Extreme raises the resolution of FireStrike, so the poor rig barely breaks 15FPS. Here we see the same thing that happened in SkyDiver. The 4.0 GHz benchmark gets a better score than the 4.5GHz because the graphics score fluxuates. The CPU physics test is solid though, still getting that 1,000 boost over the lower clock. Pretty sure the physics test is no different than the normal FireStrike, they only bump up resolution I think for Extreme.
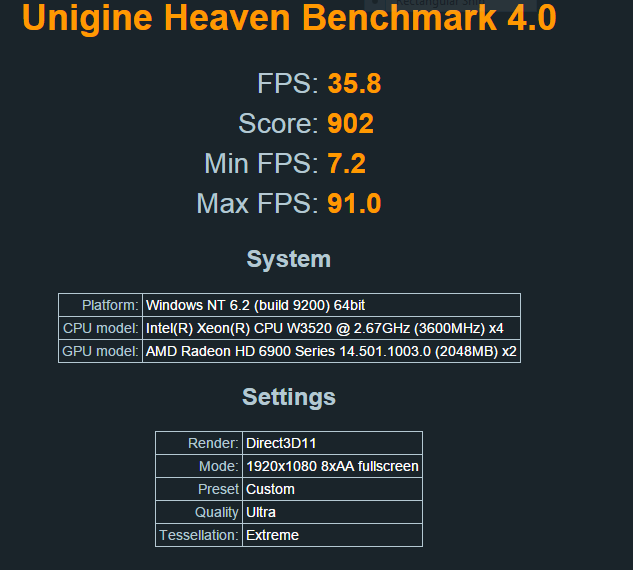
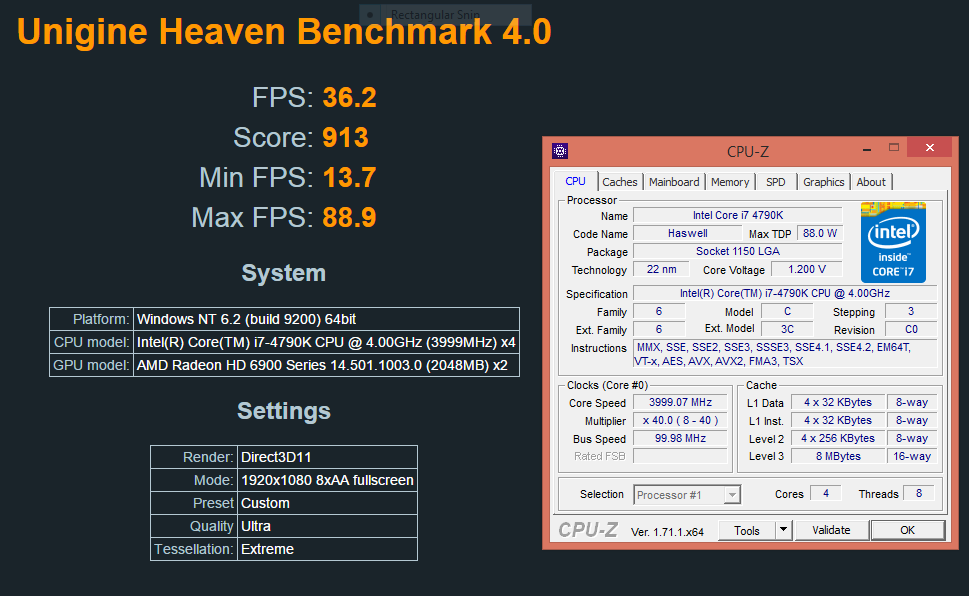
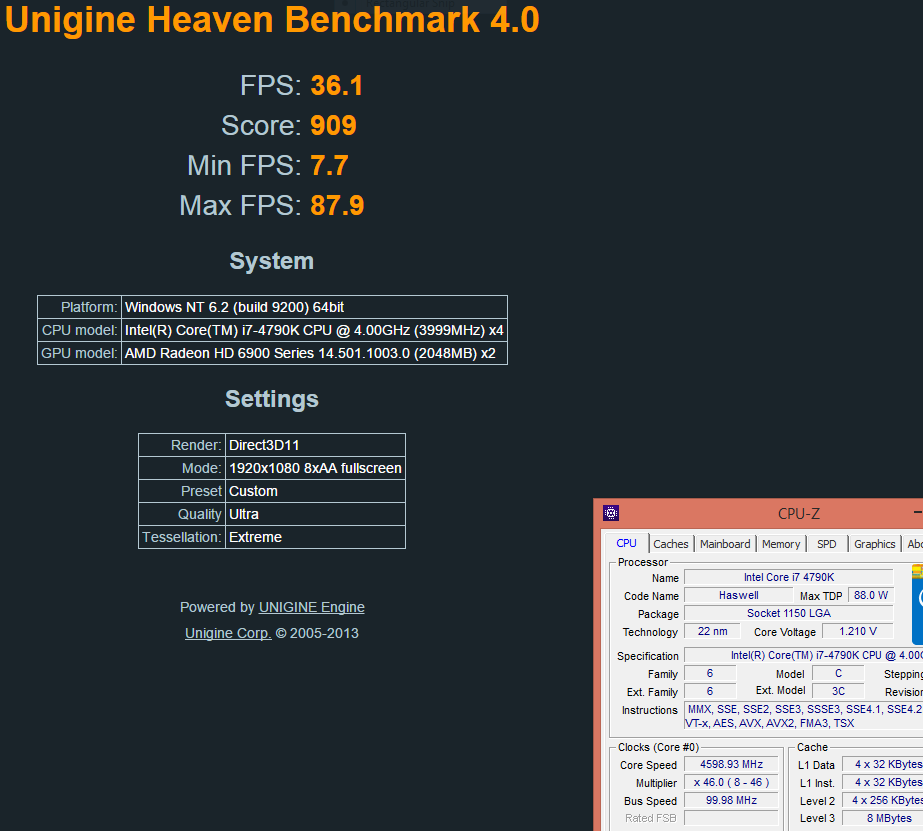
| Unigine Heaven Benchmark 4.0 | Score | Avg FPS | Min FPS | Max FPS |
|---|---|---|---|---|
| Xeon W3520 @ 3.6 | 902 | 35.8 | 7.2 | 91.0 |
| Core i7 4790k @ 4.0 | 913 | 36.2 | 13.7 | 88.9 |
| Core i7 4790k @ 4.6 | 909 | 36.1 | 7.7 | 87.9 |
Here we, again, see that the 4.6GHz overclock actually net me less FPS overall but more interesting than that is the CPU upgrade was barely noticeable. This is most likely due to the fact that Heaven is a static environment. Nothing is being simulated in Heaven I’m pretty sure, and its only for rendering on the GPU. Heaven is known for its cool GPU tesselation. But, none the less, there is a ~slight~ increase with the architecture jump.
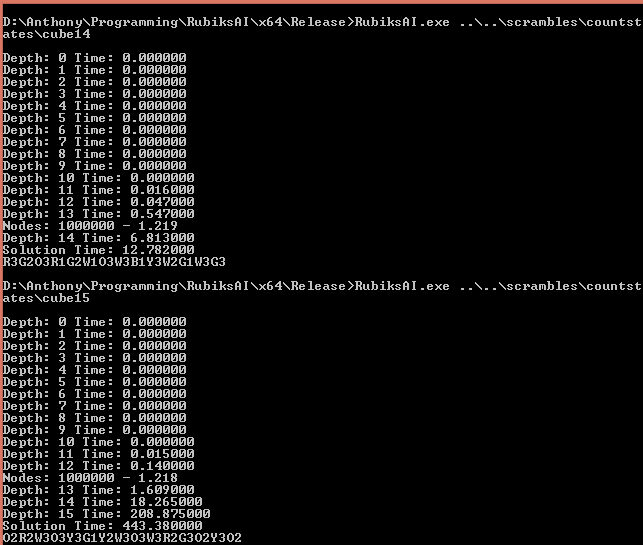
| Rubiks Cube Solver | 14 Turns | 15 Turns |
|---|---|---|
| Xeon W3520 @ 3.6 | 12.782 seconds | 443.380 seconds |
| Core i7 4790k @ 4.0 | 9.748 seconds | 344.039 seconds |
| Core i7 4790k @ 4.6 | 9.047 seconds | 312.641 seconds |
My Rubiks Cube Solver is a single threaded C++ application I had to make during my senior year of college for an Artificial Intelligence class. It takes the state of a scrambled Rubiks cube, hashes its value, looks up in a precomputed table of cube states to see how many turns are needed to solve it, and then attempts to reach the solution using iterative deepening A*. I had 2 scrambled Rubiks cubes – one that took 14 turns to solve and one that takes 15 turns to solve, and fed them in.

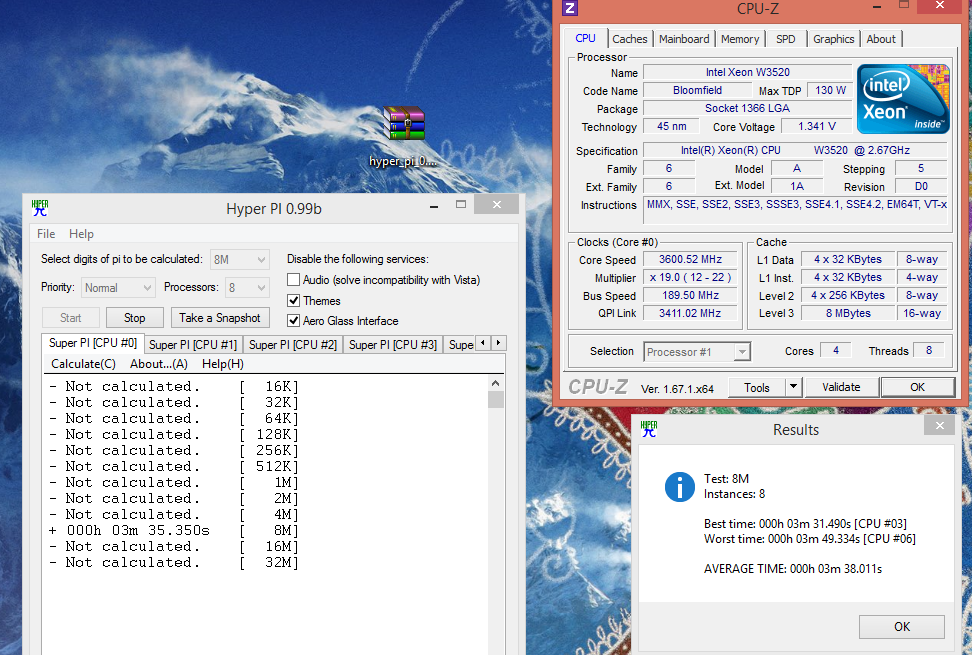
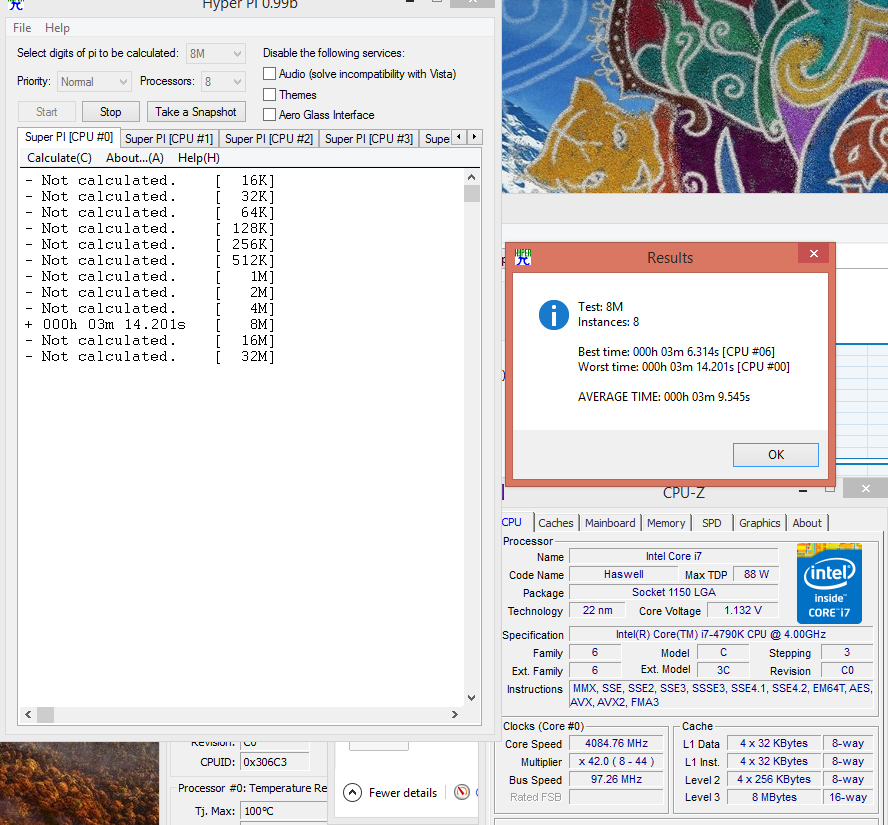
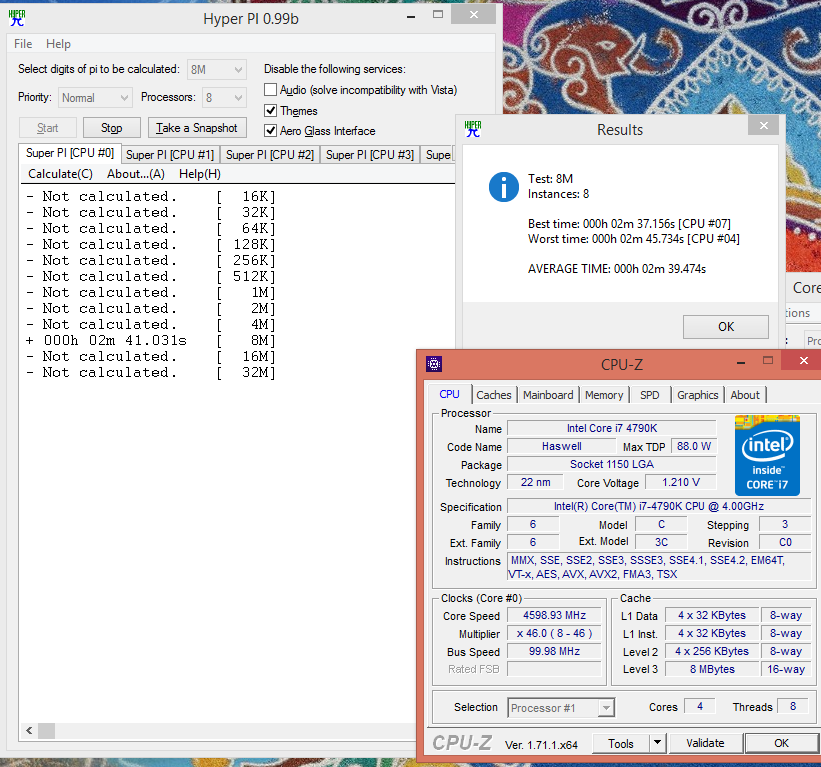
| Hyper PI 0.99b 8M | Avg time |
|---|---|
| Xeon W3520 @ 3.6 | 3m 38s |
| Core i7 4790k @ 4.0 | 3m 9.5s |
| Core i7 4790k @ 4.6 | 2m 39s |
HyperPi calculates… Pi decimal values. 8 million of them I had it set to. Here we see a very marginal change from the Xeon to 4790k, but when we kick the 4790k to 4.6GHz, we see a pretty big improvement! Clearly, the architecture in this bench isn’t as important, but the clock speed is. 3.6 to 4.0 wasn’t all that much of an improvement. But 3.6 to 4.6 is nice. At first I wondered if that has to do with the ALU/FPUs on these chips not changing much? But, that gets dashed away in the next bench….
The next bench is going to be in a different format because there are alot of numbers. I’m going to list the CPUs horizontally and the different tests/score vertically:
| SiSoftware Sandra 2015.01 | Xeon W3520 @ 3.6 | Core i7 4790k @ 4.0 | Core i7 4790k @ 4.6 |
|---|---|---|---|
| Arithmetic Native Performance (GOPS) | 79.1 | 129.8 | 143.86 |
| Arithmetic Double-float SSE4.1 (GLFOPS) | 51.25 | 77.23 | 86.75 |
| Cryptography (AES256 + SHA2-256 MT) | 1.1GB/s | 6.68GB/s | 8GB/s |
| Cryptography Per Thread | 151MB/s | 877MB/s | 1GB/s |
| Encrypt AES256 | 644MB/s | 8.5GB/s | 10.55GB/s |
| Multicore Efficiency Inter-Core Bandwidth | 22.67GB/s | 28.7GB/s | 32.58GB/s |
| Multicore Efficiency Inter-Core Latency (Lower is better) | 38.2ns | 34.9ns | 30.3 |
| .NET Arithmetic (GOPS) | 26.72 | 35 | 38.55 |
| Whetstone Double-float .NET (GFLOPS) | 47 | 63.57 | 71.26 |
| RAM Bandwidth Performance | 17.38 | 19.82 | 20.43 |
| RAM Time to Copy Capacity | 460.4ms | 403.57ms | 391.6ms |
There are 5 different tests here and some have multiple results to them. I picked out the most interesting results. You can take a peek at all of them here (tests done in order)- devilsandra devil4.6Sandra xeonSandra
So with HyperPI, I thought maybe the ALU/FPUs didn’t evolve much. But clearly, that was naive. We see major boosts in the Arithmetic and .NET Arithmetic performance jumping from the Xeon to the 4790k, and slightly more with the overclock. I specifically did .NET because I prefer it over Java and use it more. It was also the choice for my Chess Artificial Intelligence, so the results would reflect that project too. Cryptography gets a huge bonus too! I think the intercore efficiency tests are interesting to study. I believe they’re testing how fast cores can pass information to each other. 32.58GB/s over 22.67GB/s is a giant boost. Shaving almost 8 ns off the total.
The last 2 scores – RAM Bandwidth – is added even though they don’t necessarily have much to do with the CPU. They have more to do with the motherboard chipset change I believe. The RAM stayed the same as well, and you can see a whole 60ms drop time to copy. Awesome! Overclocking takes some time off of it as well, but not a whole lot. Same with bandwidth performance.
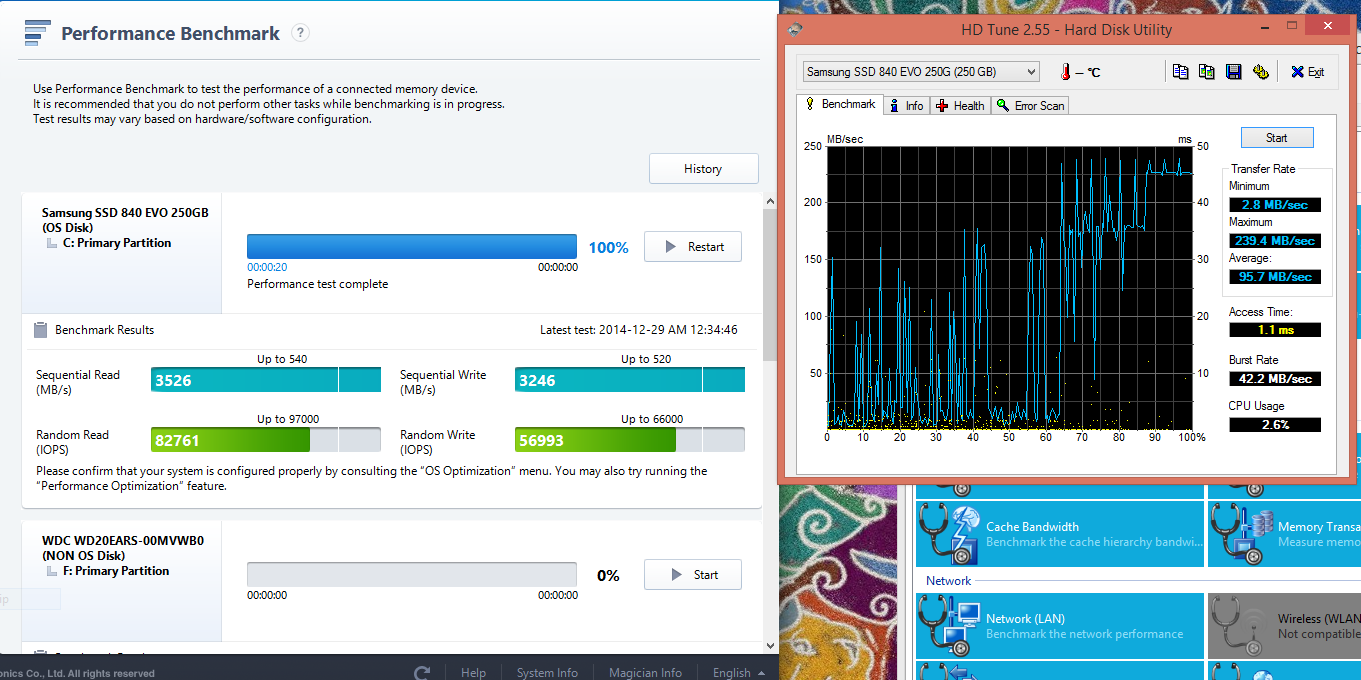
My last test is, again, irrelevant to the CPU. Has more to do with the chipset change. I use a Samsung 840 SSD after my last OCZ self destructed while working for Ubisoft in Montreal. That was a nightmare to fix, believe me. I basically was getting cabin fever without my desktop at my apartment, I stayed as late as possible at work to avoid going back to a desktop-less home. Lots of baking got done. Anyways~ I digress… the last test is a SSD test:
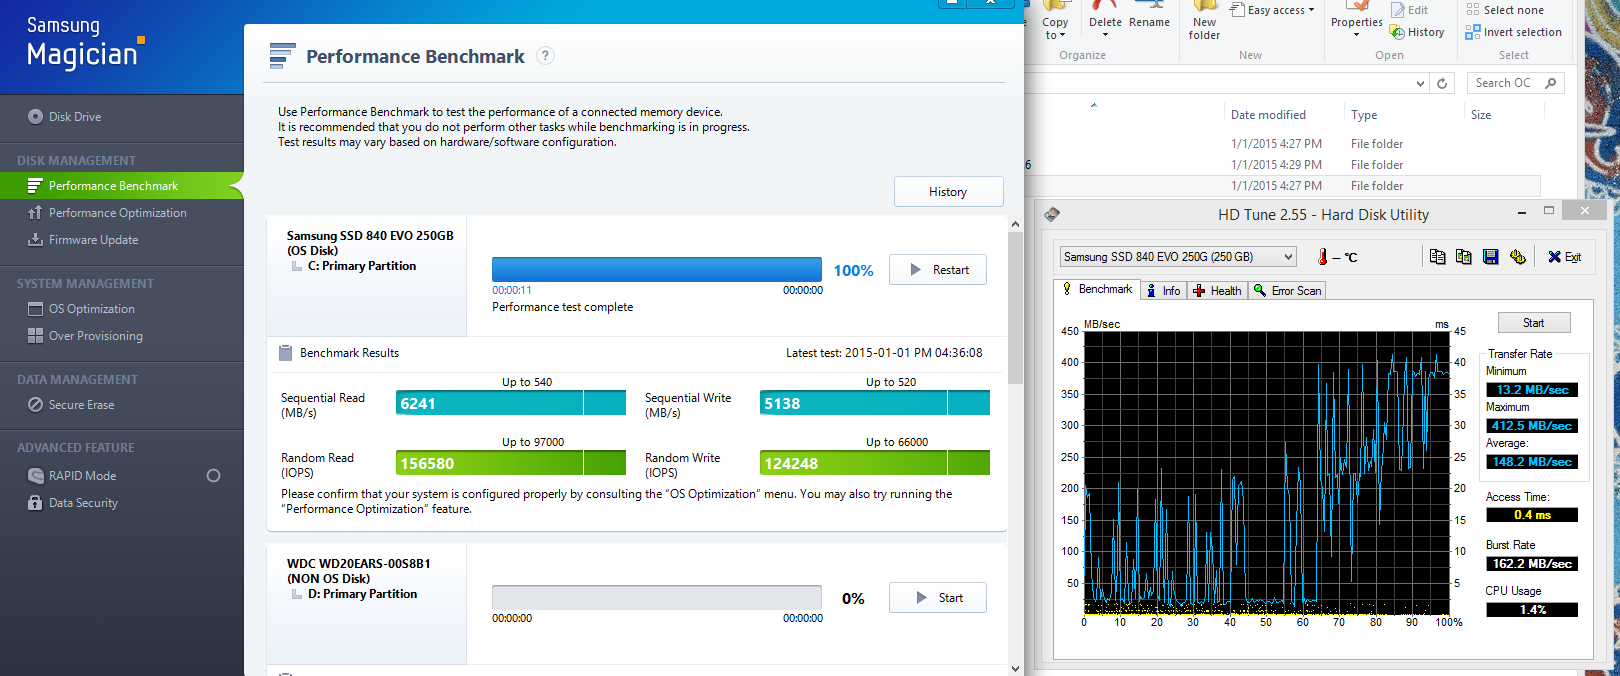
| HDTune 2.55 | Min (MB/s) | Max (MB/s) | Avg (MB/s) | Access Time (ms) | Burst Rate (MB/s) |
|---|---|---|---|---|---|
| Intel X58 | 2.8 | 239.4 | 95.7 | 1.1 | 42.2 |
| Intel Z97 | 13.2 | 412.5 | 148.2 | 0.4 | 162.2 |
The Z97 chipset has a whopping 6GB/s controller while the X58 Classified had a whimpy 3GB/s controller. Look at that burst rate! Look at the overall speed gains! Too good!
Overall, I’m so happy with this upgrade. For awhile, I debated about jumping on the Haswell-E and DDR4 boat, but decided against it because the money isn’t worth it. This upgrade, thanks to Microcenter, was only $350 total to Devil’s Canyon. Skylake will show whether or not the extra physical cores on the CPU will matter. As a programmer, the physical cores are insanely attractive, but right now I’m not doing anything too multithreaded intensive. My Chess AI, for example, doesn’t gain any benefit from a 16 core server so there’s that too. We’ll have to wait to see how Skylake truly turns out before deciding if this was a bad gamble. For now, I’m very happy with the performance and temperatures.
The 4790k benchmark was a success! I hope you found this useful!